 |
Quote Board
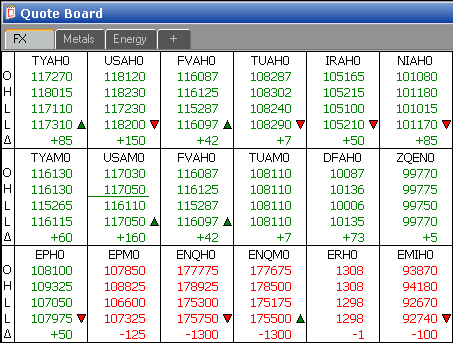
The Quote Board pages (identified by tabs) display the open (O), high (H), low (L), last (L), net change (∆), and total traded volume (based on quote display preferences) for the current trading session.
(For our purposes, we will refer to each tab or page as a quote board.)
Net change = yesterday’s settlement – yesterday’s settlement. If yesterday’s settlement is unavailable, then yesterday’s close is used. If market data is unavailable, then net change is empty.
The green arrow indicates that the last price traded was higher than the previous price. The red arrow indicates that the last price traded was lower than the previous price. If there was no change, no arrow is displayed. Green text indicates positive net change, while red text indicates negative net change. Black text indicates a net change of zero or unavailable data.


Black text can also indicate that the instrument is not enabled for real-time data.
If trading has ended, a checkmark is displayed next to the Settlement Price.

Red and green underlines indicate new low and new high, respectively. In some instances, a price is underlined in both red and a green. This is a rare, but it happens when there is no instrument state available to allow the application to determine the open, high, and low so far in the day, and a single tick arrives. Then that tick is both the new high and the new low, so you see the same price underlined in red and green.

Double-click a quote board cell to use that symbol on the trading application.
 To enter a symbol in the Quote Board
|
CQG |
